Public meetings about the siting of an Obama Presidential Library on the south side have captured headlines this week: DNAinfo, Chicago Tribune Hyde Park Herald, Chicago Tonight, The Economist, … I attended and testified at the Parks Board meeting at Hyde Park High School this last Tuesday. Nearly everyone in attendance was for “bringing it on home”, albeit with some reservations about ensuring community benefits, and some opponents solidly against using any park land for the library or any loss of open space.
Hyde Park Sidewalk Snow
Snow wreaks havoc with transportation. Entire fleets of plows keep roadways clear and airports open. Most snowy cities in North America, including Chicago, require residents to clear the sidewalks in front of their homes and businesses. There are many more linear feet of sidewalks than there are roads in the city and they are thus more expensive and slower for city workers to clear. In Chicago, compliance with the sidewalk clearing bylaw is low.
On a walk through Hyde Park earlier today, I noted 80% compliance (23 out of 31) with the snow removal bylaw from businesses, rental buildings, and multi-floor condominiums, and less than 30% compliance (20 out of 73) from private residences. I considered a sidewalk cleared of snow if there was no packed snow. I allowed loose snow carried or blown in.
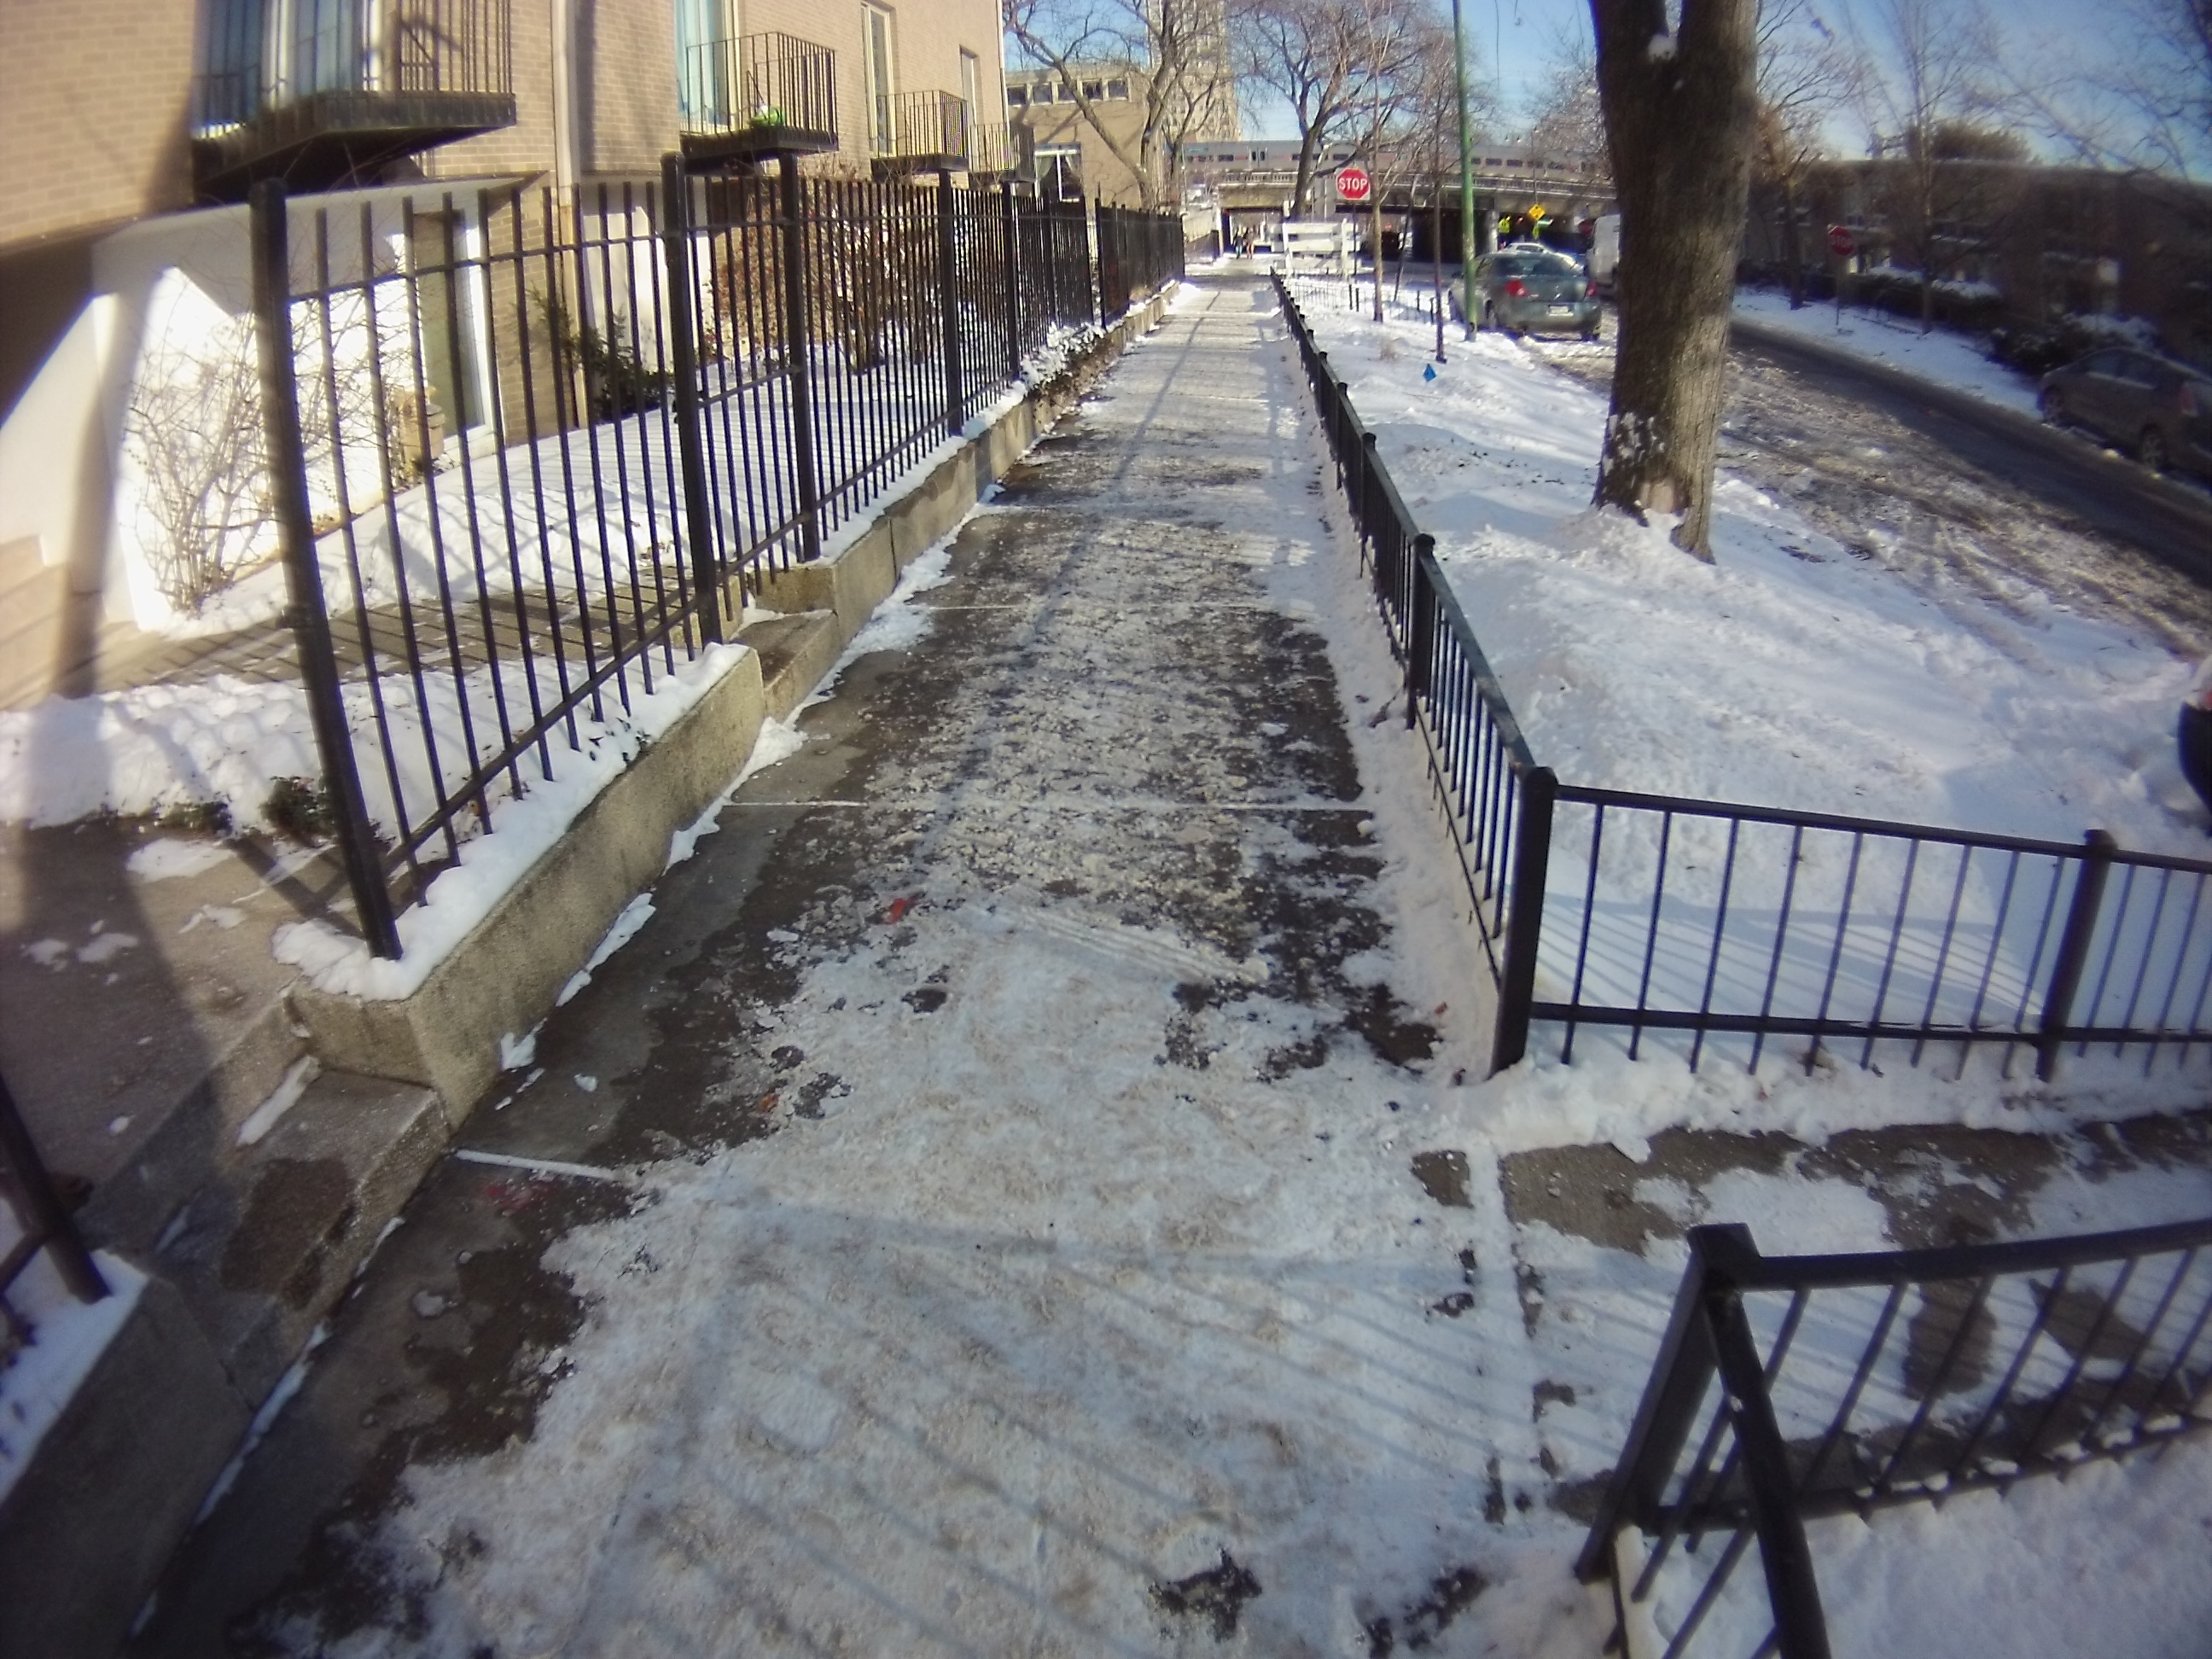
I considered the sidewalk in the middle of this image cleared. Packed snow on either side of this segment was not considered cleared.
Ashland BRT II – Travel Times
Updated 12 Jan 2015 at 9:00 AM:
I’ve used the week of 23 November 2014 to calculate delays on the Ashland bus, Thanksgiving week. I’ll update this post with data from the week of November 10th later this week.
Updated 12 Jan 2015 at 2:45 PM:
I’ve updated this post with transit tracker data from the week of November 10th. While this week does include Veteran’s Day, weekday bus service was run for the full week and travel demand would have been near normal. The inclusion of Sunday/Holiday service in the original post significantly increased the calculated waiting time for transit customers in the original post.
Original Post:
In this post, I’ll attempt to sum the time savings and cost from the proposed Ashland BRT project and the reallocation of a vehicular lane each way on Ashland to transit use. As much as possible, conservative assumptions are made such as to reduce the apparent benefits or increase the apparent cost of the BRT project.
Posted in Ashland BRT, Transit
7 Comments
Sudbury Transit Maps
I’m traveling to Sudbury, Ontario this week. As the ‘Capital of Northern Ontario’, Sudbury is a center for mining, engineering, and education. By North American standards, they invest in a very large number of service hours, which is required in order to serve the city’s spread out geography. The settlement pattern follows local nickel ore bodies, railroad yards, and fertile land spread across a large impact crater. Pulse service is provided every 15 minutes weekdays on the most important routes from 7am to 10pm with further service across the entire network until after midnight.
Posted in Transit
Leave a comment
Bus Tracker Data – First Look
Over this last week, I have been posting plots of bus positions vs. time in this folder. I’ve just updated the plots for the 5 most bunched bus routes run by the CTA: 9 – Ashland, 22 – Clark, 49 – Western, 66 – Chicago, and 79 – 79th. Excluding the 22 Clark, these are also the 4 highest ridership bus routes, which is not a surprise since ridership causes bunching.

Posted in Bus Tracker Data, Transit
Leave a comment
Plotting Bus Tracker Data
Further to last week’s post, I’ve produced a set of plots showing bus locations vs. time for the 66 Chicago bus route. These handily show where delays and bunching occur along the route.
The plots are generated by polling the CTA Bus Tracker API every minute and plotting the position (‘pdist’) of each bus along its assigned route over time. The pdist variable is offset for the various patterns associated with a route in order to compare all route patterns on the same plot. Line segments are omitted for any gaps in the data greater than 5 minutes apart or for bus speeds greater than 70 mi/hr. Given that the GPS location of CTA buses are not reported with 100% reliability, some buses either do not show on the plot or transmit unreliable positions. Large gaps in service shown on the plot may or may not be real, however bunching is real.
More plots and comments on them will be posted next Sunday.
Enjoy.
Posted in Transit
Leave a comment
The Physics of Bus Bunching
Three weeks ago, WBEZ’s Curious City segment asked why buses bunch in Chicago and what are the options for reducing bunching. As with many popular articles about physics, the piece described interesting facts while conveying a slightly incorrect intuition about the phenomenon.
The process of transit vehicle bunching requires only that customers loading causes delays. Customer caused delay is both necessary[1]Technically, a delay correlated with the time gap to the bus in front is necessary. In practice, only customer caused delays have this property. and sufficient to create bunching. Customers arriving at each stop at a constant rate create a delay for the next transit vehicle to arrive due to time required to board. The speed of the vehicle thus decreases in proportion to the excess time gap ahead of it, quadratically increasing the size of the gap over time. Through this mechanism, vehicles departing at equal intervals are in an unstable equilibrium. Any deviation from equal time intervals, identical driving, or constant customer demand will become amplified and cause bunching.
| ↑1 | Technically, a delay correlated with the time gap to the bus in front is necessary. In practice, only customer caused delays have this property. |
|---|
The University of Chicago Draft Bike Plan
Two Wednesday’s ago, the University of Chicago held a public meeting about a new draft bicycle plan for the campus. A total of 3 students, including myself, were in attendance. The possible range of initiatives for such a plan is very broad. As a friend of mine noted before the meeting, “what does a bike plan mean?” Essentially, it is a plan to develop infrastructure and policies to make cycling safe and convenient on campus.
Posted in Cycling, University of Chicago
Leave a comment
Ashland BRT I – Existing Ridership
The Ashland BRT proposal promises to provide service with similar speed and frequency of a new ‘L’ line across the heart of the city. This project would dramatically improve travel for tens of thousands of existing and potential customers. The proposed reallocation of street space to transit has received vocal opposition from businesses, a strong admonishment of the project’s Environmental Assesment from a former CDOT engineer and tepid political support. This series of posts will examine the case for BRT with some details not in the EA, potential design decisions to be made, and examinations of the concerns raised in Mr. Kaeser’s letter. Other criticisms from the Western-Ashland coalition have been well rebutted elsewhere.
Posted in Ashland BRT, Transit
Leave a comment